
OS 환경 : Oracle Linux 7.6 (64bit)
DB 환경 : Oracle Database 19.3.0.0
방법 : 오라클 19c insert 시 commit 주기에 따른 성능 테스트
dbms에서 트랜잭션의 commit 주기는 성능에 큰 영향을 미치는 중요한 요소 중 하나임
commit 주기를 어떻게 설정 하느냐에 따라 시스템의 전체적인 처리 속도와 효율성이 달라질 수 있음
본문에서는 다양한 commit 주기를 설정하여 각 주기별 성능 차이를 비교하고 분석해봄
테스트
1. insert 1번마다 commit
2. insert 10번마다 commit
3. insert 100번마다 commit
4. insert 1,000번마다 commit
5. insert 10,000번마다 commit
6. insert 100,000번마다 commit
테스트
참고로 현재 redo log size는 500mb로 설정되어 있고
매 테스트 전후로 모든 redo들을 log switch를 강제로 실행시켜 flush 시켜주었음
|
1
2
3
4
5
6
7
8
9
10
11
12
13
14
15
|
$ cat switch.sql
alter system switch logfile;
alter system switch logfile;
alter system switch logfile;
alter system switch logfile;
alter system switch logfile;
alter system switch logfile;
alter system switch logfile;
alter system checkpoint;
alter system checkpoint;
alter system checkpoint;
alter system checkpoint;
alter system checkpoint;
alter system checkpoint;
alter system checkpoint;
|
샘플 테이블 생성
|
1
2
3
4
5
6
7
8
9
10
11
12
13
|
SQL>
drop table test_table1 purge;
drop table test_table10 purge;
drop table test_table100 purge;
drop table test_table1000 purge;
drop table test_table10000 purge;
drop table test_table100000 purge;
create table test_table1 (id number, value varchar2(100));
create table test_table10 (id number, value varchar2(100));
create table test_table100 (id number, value varchar2(100));
create table test_table1000 (id number, value varchar2(100));
create table test_table10000 (id number, value varchar2(100));
create table test_table100000 (id number, value varchar2(100));
|
1. insert 1번마다 commit
redo log switch 및 checkpoint 실행
|
1
|
SQL> @switch.sql
|
10046 트레이스 실행
|
1
2
3
|
SQL>
alter session set tracefile_identifier='INCOM1';
alter session set events '10046 trace name context forever, level 12';
|
insert 실행
|
1
2
3
4
5
6
7
8
9
10
11
|
SQL>
begin
for i in 1..1000000 loop
insert into test_table1 (id, value) values (i, 'sample data ' || i);
commit;
end loop;
commit;
end;
/
PL/SQL procedure successfully completed.
|
10046 트레이스 해제
|
1
2
3
|
SQL> alter session set events '10046 trace name context off';
Session altered.
|
트레이스 경로 확인
|
1
2
3
4
5
6
7
8
9
|
SQL>
set lines 200 pages 1000
col value for a100
select value from v$diag_info
where name = 'Default Trace File';
VALUE
----------------------------------------------------------------------------------------------------
/ORA19/app/oracle/diag/rdbms/oracle19/oracle19/trace/oracle19_ora_14948_INCOM1.trc
|
tkprof 로 변환
|
1
2
|
$ cd /ORA19/app/oracle/diag/rdbms/oracle19/oracle19/trace/
$ tkprof oracle19_ora_14948_INCOM1.trc oracle19_ora_14948_INCOM1.txt sys=no
|
trace 확인
|
1
2
3
4
5
6
7
8
9
10
11
12
13
14
15
16
17
18
19
20
21
22
23
24
25
26
27
28
29
30
31
32
33
34
35
36
37
38
39
40
41
42
43
44
45
46
47
48
49
50
51
52
53
54
55
56
57
58
59
60
61
62
63
64
65
66
67
68
69
70
71
72
|
$ vi oracle19_ora_14948_INCOM1.txt
********************************************************************************
SQL ID: gcpbuxc97h6dk Plan Hash: 0
INSERT INTO TEST_TABLE1 (ID, VALUE)
VALUES
(:B1 , 'sample data ' || :B1 )
call count cpu elapsed disk query current rows
------- ------ -------- ---------- ---------- ---------- ---------- ----------
Parse 1 0.00 0.00 0 0 0 0
Execute 1000000 50.49 105.47 0 1117 3023457 1000000
Fetch 0 0.00 0.00 0 0 0 0
------- ------ -------- ---------- ---------- ---------- ---------- ----------
total 1000001 50.49 105.47 0 1117 3023457 1000000
Misses in library cache during parse: 1
Misses in library cache during execute: 1
Optimizer mode: ALL_ROWS
Parsing user id: 78 (recursive depth: 1)
Number of plan statistics captured: 1
Rows (1st) Rows (avg) Rows (max) Row Source Operation
---------- ---------- ---------- ---------------------------------------------------
0 0 0 LOAD TABLE CONVENTIONAL TEST_TABLE1 (cr=4 pr=0 pw=0 time=602 us starts=1)
********************************************************************************
SQL ID: 8ggw94h7mvxd7 Plan Hash: 0
COMMIT
call count cpu elapsed disk query current rows
------- ------ -------- ---------- ---------- ---------- ---------- ----------
Parse 3 0.00 0.00 0 0 0 0
Execute 1000001 22.66 57.10 0 0 1000000 0
Fetch 0 0.00 0.00 0 0 0 0
------- ------ -------- ---------- ---------- ---------- ---------- ----------
total 1000004 22.66 57.10 0 0 1000000 0
Misses in library cache during parse: 0
Parsing user id: 78 (recursive depth: 1)
Elapsed times include waiting on following events:
Event waited on Times Max. Wait Total Waited
---------------------------------------- Waited ---------- ------------
latch: redo allocation 3 0.01 0.02
log file switch completion 1 0.02 0.02
********************************************************************************
.
.
OVERALL TOTALS FOR ALL RECURSIVE STATEMENTS
call count cpu elapsed disk query current rows
------- ------ -------- ---------- ---------- ---------- ---------- ----------
Parse 15 0.00 0.00 0 0 0 0
Execute 2000014 73.16 162.58 0 1132 4023465 1000005
Fetch 6 0.00 0.00 0 14 0 2
------- ------ -------- ---------- ---------- ---------- ---------- ----------
total 2000035 73.16 162.59 0 1146 4023465 1000007
Misses in library cache during parse: 1
Misses in library cache during execute: 1
Elapsed times include waiting on following events:
Event waited on Times Max. Wait Total Waited
---------------------------------------- Waited ---------- ------------
latch: redo allocation 3 0.01 0.02
log file switch completion 1 0.02 0.02
|
insert 100만번, commit 100만번 실행됨
총 162.59초 소요됨
2. insert 10번마다 commit
redo log switch 및 checkpoint 실행
|
1
|
SQL> @switch.sql
|
10046 트레이스 실행
|
1
2
3
|
SQL>
alter session set tracefile_identifier='INCOM10';
alter session set events '10046 trace name context forever, level 12';
|
insert 실행
|
1
2
3
4
5
6
7
8
9
10
11
12
13
14
15
16
17
18
19
|
SQL>
begin
declare
v_counter number := 0;
begin
for i in 1..1000000 loop
insert into test_table10 (id, value) values (i, 'sample data ' || i);
v_counter := v_counter + 1;
if v_counter = 10 then
commit;
v_counter := 0;
end if;
end loop;
commit;
end;
end;
/
PL/SQL procedure successfully completed.
|
10046 트레이스 해제
|
1
2
3
|
SQL> alter session set events '10046 trace name context off';
Session altered.
|
트레이스 경로 확인
|
1
2
3
4
5
6
7
8
9
|
SQL>
set lines 200 pages 1000
col value for a100
select value from v$diag_info
where name = 'Default Trace File';
VALUE
----------------------------------------------------------------------------------------------------
/ORA19/app/oracle/diag/rdbms/oracle19/oracle19/trace/oracle19_ora_23382_INCOM10.trc
|
tkprof 로 변환
|
1
2
|
$ cd /ORA19/app/oracle/diag/rdbms/oracle19/oracle19/trace/
$ tkprof oracle19_ora_23382_INCOM10.trc oracle19_ora_23382_INCOM10.txt sys=no
|
trace 확인
|
1
2
3
4
5
6
7
8
9
10
11
12
13
14
15
16
17
18
19
20
21
22
23
24
25
26
27
28
29
30
31
32
33
34
35
36
37
38
39
40
41
42
43
44
45
46
47
48
49
50
51
52
53
54
55
56
57
58
59
60
61
62
63
64
65
66
67
68
69
70
71
72
73
74
|
$ vi oracle19_ora_23382_INCOM10.txt
********************************************************************************
SQL ID: dm7r6mas29zx5 Plan Hash: 0
INSERT INTO TEST_TABLE10 (ID, VALUE)
VALUES
(:B1 , 'sample data ' || :B1 )
call count cpu elapsed disk query current rows
------- ------ -------- ---------- ---------- ---------- ---------- ----------
Parse 1 0.00 0.00 0 0 0 0
Execute 1000000 40.31 80.08 0 4811 1236883 1000000
Fetch 0 0.00 0.00 0 0 0 0
------- ------ -------- ---------- ---------- ---------- ---------- ----------
total 1000001 40.31 80.08 0 4811 1236883 1000000
Misses in library cache during parse: 1
Misses in library cache during execute: 1
Optimizer mode: ALL_ROWS
Parsing user id: 78 (recursive depth: 1)
Number of plan statistics captured: 1
Rows (1st) Rows (avg) Rows (max) Row Source Operation
---------- ---------- ---------- ---------------------------------------------------
0 0 0 LOAD TABLE CONVENTIONAL TEST_TABLE10 (cr=4 pr=0 pw=0 time=309 us starts=1)
Elapsed times include waiting on following events:
Event waited on Times Max. Wait Total Waited
---------------------------------------- Waited ---------- ------------
asynch descriptor resize 1 0.00 0.00
Disk file operations I/O 2 0.00 0.00
PGA memory operation 1 0.00 0.00
********************************************************************************
SQL ID: 8ggw94h7mvxd7 Plan Hash: 0
COMMIT
call count cpu elapsed disk query current rows
------- ------ -------- ---------- ---------- ---------- ---------- ----------
Parse 2 0.00 0.00 0 0 0 0
Execute 100001 4.77 12.93 0 0 100000 0
Fetch 0 0.00 0.00 0 0 0 0
------- ------ -------- ---------- ---------- ---------- ---------- ----------
total 100003 4.77 12.93 0 0 100000 0
Misses in library cache during parse: 0
Parsing user id: 78 (recursive depth: 1)
********************************************************************************
.
.
OVERALL TOTALS FOR ALL RECURSIVE STATEMENTS
call count cpu elapsed disk query current rows
------- ------ -------- ---------- ---------- ---------- ---------- ----------
Parse 25 0.00 0.00 0 2 0 0
Execute 1100030 45.09 93.02 0 4826 1336891 1000005
Fetch 36 0.00 0.00 0 65 0 18
------- ------ -------- ---------- ---------- ---------- ---------- ----------
total 1100091 45.10 93.03 0 4893 1336891 1000023
Misses in library cache during parse: 4
Misses in library cache during execute: 2
Elapsed times include waiting on following events:
Event waited on Times Max. Wait Total Waited
---------------------------------------- Waited ---------- ------------
PGA memory operation 9 0.00 0.00
asynch descriptor resize 1 0.00 0.00
Disk file operations I/O 2 0.00 0.00
|
insert 100만번, commit 10만번 실행됨
총 93.03초 소요됨
3. insert 100번마다 commit
redo log switch 및 checkpoint 실행
|
1
|
SQL> @switch.sql
|
10046 트레이스 실행
|
1
2
3
|
SQL>
alter session set tracefile_identifier='INCOM100';
alter session set events '10046 trace name context forever, level 12';
|
insert 실행
|
1
2
3
4
5
6
7
8
9
10
11
12
13
14
15
16
17
18
19
|
SQL>
begin
declare
v_counter number := 0;
begin
for i in 1..1000000 loop
insert into test_table1 (id, value) values (i, 'sample data ' || i);
v_counter := v_counter + 1;
if v_counter = 100 then
commit;
v_counter := 0;
end if;
end loop;
commit;
end;
end;
/
PL/SQL procedure successfully completed.
|
10046 트레이스 해제
|
1
2
3
|
SQL> alter session set events '10046 trace name context off';
Session altered.
|
트레이스 경로 확인
|
1
2
3
4
5
6
7
8
9
|
SQL>
set lines 200 pages 1000
col value for a100
select value from v$diag_info
where name = 'Default Trace File';
VALUE
----------------------------------------------------------------------------------------------------
/ORA19/app/oracle/diag/rdbms/oracle19/oracle19/trace/oracle19_ora_27399_INCOM100.trc
|
tkprof 로 변환
|
1
2
|
$ cd /ORA19/app/oracle/diag/rdbms/oracle19/oracle19/trace/
$ tkprof oracle19_ora_27399_INCOM100.trc oracle19_ora_27399_INCOM100.txt sys=no
|
trace 확인
|
1
2
3
4
5
6
7
8
9
10
11
12
13
14
15
16
17
18
19
20
21
22
23
24
25
26
27
28
29
30
31
32
33
34
35
36
37
38
39
40
41
42
43
44
45
46
47
48
49
50
51
52
53
54
55
56
57
58
59
60
61
62
63
64
65
66
67
68
69
70
71
72
73
74
75
76
|
$ vi oracle19_ora_27399_INCOM100.txt
********************************************************************************
SQL ID: gcpbuxc97h6dk Plan Hash: 0
INSERT INTO TEST_TABLE1 (ID, VALUE)
VALUES
(:B1 , 'sample data ' || :B1 )
call count cpu elapsed disk query current rows
------- ------ -------- ---------- ---------- ---------- ---------- ----------
Parse 1 0.00 0.00 0 0 0 0
Execute 1000000 39.99 79.75 0 4373 1062769 1000000
Fetch 0 0.00 0.00 0 0 0 0
------- ------ -------- ---------- ---------- ---------- ---------- ----------
total 1000001 39.99 79.75 0 4373 1062769 1000000
Misses in library cache during parse: 1
Misses in library cache during execute: 1
Optimizer mode: ALL_ROWS
Parsing user id: 78 (recursive depth: 1)
Number of plan statistics captured: 1
Rows (1st) Rows (avg) Rows (max) Row Source Operation
---------- ---------- ---------- ---------------------------------------------------
0 0 0 LOAD TABLE CONVENTIONAL TEST_TABLE1 (cr=4 pr=0 pw=0 time=323 us starts=1)
Elapsed times include waiting on following events:
Event waited on Times Max. Wait Total Waited
---------------------------------------- Waited ---------- ------------
asynch descriptor resize 1 0.00 0.00
Disk file operations I/O 2 0.00 0.00
PGA memory operation 1 0.00 0.00
reliable message 3 0.00 0.00
********************************************************************************
SQL ID: 8ggw94h7mvxd7 Plan Hash: 0
COMMIT
call count cpu elapsed disk query current rows
------- ------ -------- ---------- ---------- ---------- ---------- ----------
Parse 2 0.00 0.00 0 0 0 0
Execute 10001 1.08 4.15 0 0 10000 0
Fetch 0 0.00 0.00 0 0 0 0
------- ------ -------- ---------- ---------- ---------- ---------- ----------
total 10003 1.08 4.15 0 0 10000 0
Misses in library cache during parse: 0
Parsing user id: 78 (recursive depth: 1)
********************************************************************************
.
.
OVERALL TOTALS FOR ALL RECURSIVE STATEMENTS
call count cpu elapsed disk query current rows
------- ------ -------- ---------- ---------- ---------- ---------- ----------
Parse 16 0.00 0.00 0 0 0 0
Execute 1010016 41.08 83.90 0 4390 1072929 1000005
Fetch 8 0.00 0.00 0 46 0 4
------- ------ -------- ---------- ---------- ---------- ---------- ----------
total 1010040 41.08 83.90 0 4436 1072929 1000009
Misses in library cache during parse: 1
Misses in library cache during execute: 1
Elapsed times include waiting on following events:
Event waited on Times Max. Wait Total Waited
---------------------------------------- Waited ---------- ------------
PGA memory operation 4 0.00 0.00
asynch descriptor resize 1 0.00 0.00
Disk file operations I/O 2 0.00 0.00
reliable message 3 0.00 0.00
|
insert 100만번, commit 1만번 실행됨
총 83.90초 소요됨
4. insert 1,000번마다 commit
redo log switch 및 checkpoint 실행
|
1
|
SQL> @switch.sql
|
10046 트레이스 실행
|
1
2
3
|
SQL>
alter session set tracefile_identifier='INCOM1000';
alter session set events '10046 trace name context forever, level 12';
|
insert 실행
|
1
2
3
4
5
6
7
8
9
10
11
12
13
14
15
16
17
18
19
|
SQL>
begin
declare
v_counter number := 0;
begin
for i in 1..1000000 loop
insert into test_table1 (id, value) values (i, 'sample data ' || i);
v_counter := v_counter + 1;
if v_counter = 1000 then
commit;
v_counter := 0;
end if;
end loop;
commit;
end;
end;
/
PL/SQL procedure successfully completed.
|
10046 트레이스 해제
|
1
2
3
|
SQL> alter session set events '10046 trace name context off';
Session altered.
|
트레이스 경로 확인
|
1
2
3
4
5
6
7
8
9
|
SQL>
set lines 200 pages 1000
col value for a100
select value from v$diag_info
where name = 'Default Trace File';
VALUE
----------------------------------------------------------------------------------------------------
/ORA19/app/oracle/diag/rdbms/oracle19/oracle19/trace/oracle19_ora_29980_INCOM1000.trc
|
tkprof 로 변환
|
1
2
|
$ cd /ORA19/app/oracle/diag/rdbms/oracle19/oracle19/trace/
$ tkprof oracle19_ora_29980_INCOM1000.trc oracle19_ora_29980_INCOM1000.txt sys=no
|
trace 확인
|
1
2
3
4
5
6
7
8
9
10
11
12
13
14
15
16
17
18
19
20
21
22
23
24
25
26
27
28
29
30
31
32
33
34
35
36
37
38
39
40
41
42
43
44
45
46
47
48
49
50
51
52
53
54
55
56
57
58
59
60
61
62
63
64
65
66
67
68
69
70
71
72
73
74
|
$ vi oracle19_ora_29980_INCOM1000.txt
********************************************************************************
SQL ID: gcpbuxc97h6dk Plan Hash: 0
INSERT INTO TEST_TABLE1 (ID, VALUE)
VALUES
(:B1 , 'sample data ' || :B1 )
call count cpu elapsed disk query current rows
------- ------ -------- ---------- ---------- ---------- ---------- ----------
Parse 1 0.00 0.00 0 0 0 0
Execute 1000000 40.34 82.32 0 3991 1046153 1000000
Fetch 0 0.00 0.00 0 0 0 0
------- ------ -------- ---------- ---------- ---------- ---------- ----------
total 1000001 40.34 82.32 0 3991 1046153 1000000
Misses in library cache during parse: 0
Optimizer mode: ALL_ROWS
Parsing user id: 78 (recursive depth: 1)
Number of plan statistics captured: 1
Rows (1st) Rows (avg) Rows (max) Row Source Operation
---------- ---------- ---------- ---------------------------------------------------
0 0 0 LOAD TABLE CONVENTIONAL TEST_TABLE1 (cr=1 pr=0 pw=0 time=170 us starts=1)
Elapsed times include waiting on following events:
Event waited on Times Max. Wait Total Waited
---------------------------------------- Waited ---------- ------------
asynch descriptor resize 1 0.00 0.00
Disk file operations I/O 2 0.00 0.00
PGA memory operation 1 0.00 0.00
reliable message 3 0.00 0.01
********************************************************************************
SQL ID: 8ggw94h7mvxd7 Plan Hash: 0
COMMIT
call count cpu elapsed disk query current rows
------- ------ -------- ---------- ---------- ---------- ---------- ----------
Parse 2 0.00 0.00 0 0 0 0
Execute 1001 0.13 0.87 0 0 1000 0
Fetch 0 0.00 0.00 0 0 0 0
------- ------ -------- ---------- ---------- ---------- ---------- ----------
total 1003 0.13 0.87 0 0 1000 0
Misses in library cache during parse: 0
Parsing user id: 78 (recursive depth: 1)
********************************************************************************
.
.
OVERALL TOTALS FOR ALL RECURSIVE STATEMENTS
call count cpu elapsed disk query current rows
------- ------ -------- ---------- ---------- ---------- ---------- ----------
Parse 5 0.00 0.00 0 0 0 0
Execute 1001003 40.48 83.20 0 3991 1047153 1000000
Fetch 2 0.00 0.00 0 33 0 2
------- ------ -------- ---------- ---------- ---------- ---------- ----------
total 1001010 40.48 83.20 0 4024 1047153 1000002
Misses in library cache during parse: 0
Elapsed times include waiting on following events:
Event waited on Times Max. Wait Total Waited
---------------------------------------- Waited ---------- ------------
PGA memory operation 1 0.00 0.00
asynch descriptor resize 1 0.00 0.00
Disk file operations I/O 2 0.00 0.00
reliable message 3 0.00 0.01
|
insert 100만번, commit 1천번 실행됨
총 83.20초 소요됨
5. insert 10,000번마다 commit
redo log switch 및 checkpoint 실행
|
1
|
SQL> @switch.sql
|
10046 트레이스 실행
|
1
2
3
|
SQL>
alter session set tracefile_identifier='INCOM10000';
alter session set events '10046 trace name context forever, level 12';
|
insert 실행
|
1
2
3
4
5
6
7
8
9
10
11
12
13
14
15
16
17
18
19
|
SQL>
begin
declare
v_counter number := 0;
begin
for i in 1..1000000 loop
insert into test_table1 (id, value) values (i, 'sample data ' || i);
v_counter := v_counter + 1;
if v_counter = 10000 then
commit;
v_counter := 0;
end if;
end loop;
commit;
end;
end;
/
PL/SQL procedure successfully completed.
|
10046 트레이스 해제
|
1
2
3
|
SQL> alter session set events '10046 trace name context off';
Session altered.
|
트레이스 경로 확인
|
1
2
3
4
5
6
7
8
9
|
SQL>
set lines 200 pages 1000
col value for a100
select value from v$diag_info
where name = 'Default Trace File';
VALUE
----------------------------------------------------------------------------------------------------
/ORA19/app/oracle/diag/rdbms/oracle19/oracle19/trace/oracle19_ora_34313_INCOM10000.trc
|
tkprof 로 변환
|
1
2
|
$ cd /ORA19/app/oracle/diag/rdbms/oracle19/oracle19/trace/
$ tkprof oracle19_ora_34313_INCOM10000.trc oracle19_ora_34313_INCOM10000.txt sys=no
|
trace 확인
|
1
2
3
4
5
6
7
8
9
10
11
12
13
14
15
16
17
18
19
20
21
22
23
24
25
26
27
28
29
30
31
32
33
34
35
36
37
38
39
40
41
42
43
44
45
46
47
48
49
50
51
52
53
54
55
56
57
58
59
60
61
62
63
64
65
66
67
68
69
70
71
72
73
74
|
$ vi oracle19_ora_34313_INCOM10000.txt
********************************************************************************
SQL ID: gcpbuxc97h6dk Plan Hash: 0
INSERT INTO TEST_TABLE1 (ID, VALUE)
VALUES
(:B1 , 'sample data ' || :B1 )
call count cpu elapsed disk query current rows
------- ------ -------- ---------- ---------- ---------- ---------- ----------
Parse 1 0.00 0.00 0 0 0 0
Execute 1000000 39.43 79.84 0 3813 1043534 1000000
Fetch 0 0.00 0.00 0 0 0 0
------- ------ -------- ---------- ---------- ---------- ---------- ----------
total 1000001 39.43 79.84 0 3813 1043534 1000000
Misses in library cache during parse: 0
Optimizer mode: ALL_ROWS
Parsing user id: 78 (recursive depth: 1)
Number of plan statistics captured: 1
Rows (1st) Rows (avg) Rows (max) Row Source Operation
---------- ---------- ---------- ---------------------------------------------------
0 0 0 LOAD TABLE CONVENTIONAL TEST_TABLE1 (cr=1 pr=0 pw=0 time=174 us starts=1)
Elapsed times include waiting on following events:
Event waited on Times Max. Wait Total Waited
---------------------------------------- Waited ---------- ------------
asynch descriptor resize 1 0.00 0.00
Disk file operations I/O 2 0.00 0.00
PGA memory operation 1 0.00 0.00
reliable message 9 0.00 0.02
********************************************************************************
SQL ID: 8ggw94h7mvxd7 Plan Hash: 0
COMMIT
call count cpu elapsed disk query current rows
------- ------ -------- ---------- ---------- ---------- ---------- ----------
Parse 2 0.00 0.00 0 0 0 0
Execute 101 0.01 0.16 0 0 100 0
Fetch 0 0.00 0.00 0 0 0 0
------- ------ -------- ---------- ---------- ---------- ---------- ----------
total 103 0.01 0.16 0 0 100 0
Misses in library cache during parse: 0
Parsing user id: 78 (recursive depth: 1)
********************************************************************************
.
.
OVERALL TOTALS FOR ALL RECURSIVE STATEMENTS
call count cpu elapsed disk query current rows
------- ------ -------- ---------- ---------- ---------- ---------- ----------
Parse 9 0.00 0.00 0 0 0 0
Execute 1000107 39.45 80.00 0 3813 1043634 1000000
Fetch 6 0.00 0.00 0 99 0 6
------- ------ -------- ---------- ---------- ---------- ---------- ----------
total 1000122 39.45 80.00 0 3912 1043634 1000006
Misses in library cache during parse: 0
Elapsed times include waiting on following events:
Event waited on Times Max. Wait Total Waited
---------------------------------------- Waited ---------- ------------
PGA memory operation 1 0.00 0.00
asynch descriptor resize 1 0.00 0.00
Disk file operations I/O 2 0.00 0.00
reliable message 9 0.00 0.02
|
insert 100만번, commit 100번 실행됨
총 80.00초 소요됨
6. insert 100,000번마다 commit
redo log switch 및 checkpoint 실행
|
1
|
SQL> @switch.sql
|
10046 트레이스 실행
|
1
2
3
|
SQL>
alter session set tracefile_identifier='INCOM100000';
alter session set events '10046 trace name context forever, level 12';
|
insert 실행
|
1
2
3
4
5
6
7
8
9
10
11
12
13
14
15
16
17
18
19
|
SQL>
begin
declare
v_counter number := 0;
begin
for i in 1..1000000 loop
insert into test_table1 (id, value) values (i, 'sample data ' || i);
v_counter := v_counter + 1;
if v_counter = 100000 then
commit;
v_counter := 0;
end if;
end loop;
commit;
end;
end;
/
PL/SQL procedure successfully completed.
|
10046 트레이스 해제
|
1
2
3
|
SQL> alter session set events '10046 trace name context off';
Session altered.
|
트레이스 경로 확인
|
1
2
3
4
5
6
7
8
9
|
SQL>
set lines 200 pages 1000
col value for a100
select value from v$diag_info
where name = 'Default Trace File';
VALUE
----------------------------------------------------------------------------------------------------
/ORA19/app/oracle/diag/rdbms/oracle19/oracle19/trace/INCOM100000.trc
|
tkprof 로 변환
|
1
2
|
$ cd /ORA19/app/oracle/diag/rdbms/oracle19/oracle19/trace/
$ tkprof INCOM100000.trc INCOM100000.txt sys=no
|
trace 확인
|
1
2
3
4
5
6
7
8
9
10
11
12
13
14
15
16
17
18
19
20
21
22
23
24
25
26
27
28
29
30
31
32
33
34
35
36
37
38
39
40
41
42
43
44
45
46
47
48
49
50
51
52
53
54
55
56
57
58
59
60
61
62
63
64
65
66
67
68
69
70
71
72
73
74
|
$ vi INCOM100000.txt
********************************************************************************
SQL ID: gcpbuxc97h6dk Plan Hash: 0
INSERT INTO TEST_TABLE1 (ID, VALUE)
VALUES
(:B1 , 'sample data ' || :B1 )
call count cpu elapsed disk query current rows
------- ------ -------- ---------- ---------- ---------- ---------- ----------
Parse 1 0.00 0.00 0 0 0 0
Execute 1000000 39.98 81.90 0 3749 1043094 1000000
Fetch 0 0.00 0.00 0 0 0 0
------- ------ -------- ---------- ---------- ---------- ---------- ----------
total 1000001 39.98 81.90 0 3749 1043094 1000000
Misses in library cache during parse: 0
Optimizer mode: ALL_ROWS
Parsing user id: 78 (recursive depth: 1)
Number of plan statistics captured: 1
Rows (1st) Rows (avg) Rows (max) Row Source Operation
---------- ---------- ---------- ---------------------------------------------------
0 0 0 LOAD TABLE CONVENTIONAL TEST_TABLE1 (cr=1 pr=0 pw=0 time=136 us starts=1)
Elapsed times include waiting on following events:
Event waited on Times Max. Wait Total Waited
---------------------------------------- Waited ---------- ------------
asynch descriptor resize 1 0.00 0.00
Disk file operations I/O 2 0.00 0.00
reliable message 12 0.00 0.03
undo segment extension 12 0.32 0.81
********************************************************************************
SQL ID: 8ggw94h7mvxd7 Plan Hash: 0
COMMIT
call count cpu elapsed disk query current rows
------- ------ -------- ---------- ---------- ---------- ---------- ----------
Parse 2 0.00 0.00 0 0 0 0
Execute 11 0.00 0.03 0 0 10 0
Fetch 0 0.00 0.00 0 0 0 0
------- ------ -------- ---------- ---------- ---------- ---------- ----------
total 13 0.00 0.03 0 0 10 0
Misses in library cache during parse: 0
Parsing user id: 78 (recursive depth: 1)
********************************************************************************
.
.
OVERALL TOTALS FOR ALL RECURSIVE STATEMENTS
call count cpu elapsed disk query current rows
------- ------ -------- ---------- ---------- ---------- ---------- ----------
Parse 8 0.00 0.00 0 0 0 0
Execute 1000016 39.99 81.94 0 3752 1043105 1000001
Fetch 4 0.00 0.00 0 66 0 4
------- ------ -------- ---------- ---------- ---------- ---------- ----------
total 1000028 39.99 81.94 0 3818 1043105 1000005
Misses in library cache during parse: 0
Elapsed times include waiting on following events:
Event waited on Times Max. Wait Total Waited
---------------------------------------- Waited ---------- ------------
asynch descriptor resize 1 0.00 0.00
Disk file operations I/O 2 0.00 0.00
reliable message 12 0.00 0.03
undo segment extension 12 0.32 0.81
|
insert 100만번, commit 10번 실행됨
총 81.94초 소요됨
결론 :
1. insert 1번마다 commit : 162.59초 소요
2. insert 10번마다 commit : 93.03초 소요
3. insert 100번마다 commit : 83.90초 소요
4. insert 1,000번마다 commit : 83.20초 소요
5. insert 10,000번마다 commit : 80.00초 소요
6. insert 100,000번마다 commit : 81.94초 소요
| insert 건수 | commit 주기 | commit 횟수 | elapsed time(sec) | ||
| insert | commit | total | |||
| 1,000,000 | 1 | 1,000,000 | 105.47 | 57.1 | 162.59 |
| 1,000,000 | 10 | 100,000 | 80.08 | 12.93 | 93.03 |
| 1,000,000 | 100 | 10,000 | 79.75 | 4.15 | 83.9 |
| 1,000,000 | 1,000 | 1,000 | 82.32 | 0.87 | 83.2 |
| 1,000,000 | 10,000 | 100 | 79.84 | 0.16 | 80 |
| 1,000,000 | 100,000 | 10 | 81.9 | 0.03 | 81.94 |
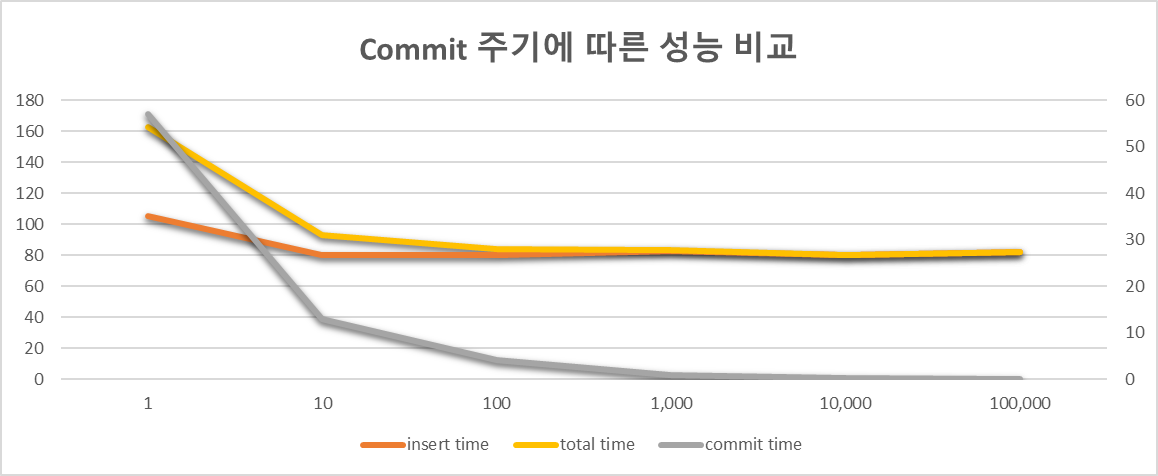
commit 주기가 짧을수록 (commit을 자주 할수록) 총 소요 시간이 길어짐
총 소요 시간이 적게 소요된 commit 주기는 10,000번 이었음
하지만 insert 시에 약 80초 정도가 소요되고 commit은 수행을 적게할수록 시간이 더 줄어듬
commit 자주 할수록 I/O와 트랜잭션 관리를 위한 오버헤드가 크게 증가함
db 환경에 따라서도 결과가 달라질 수 있기때문에 개별 운영 환경에 맞춰서 commit 주기를 최적으로 조정해야함
참조 :
https://docs.oracle.com/en/database/oracle/oracle-database/19/sqlrf/COMMIT.html
https://docs.oracle.com/en/database/oracle/oracle-database/19/cncpt/transactions.html#GUID-C3FE1082-94AA-4BE8-98F2-480205D99DCA
https://docs.oracle.com/en/database/oracle/oracle-database/19/refrn/COMMIT_WAIT.html
https://docs.oracle.com/en/database/oracle/oracle-database/19/refrn/COMMIT_LOGGING.html
https://cafe.naver.com/dbian/3411
https://oracle-base.com/articles/10g/commit-10gr2
'ORACLE > Performance Tuning ' 카테고리의 다른 글
| 오라클 19c hash 조인 과다 실행시 부하 테스트 (0) | 2024.05.28 |
|---|---|
| 오라클 19c ordered_predicates 힌트 사용 확인(xplan, 10053 비교) (0) | 2024.05.24 |
| 오라클 19c 일반 insert, insert all, union all insert 성능 테스트(컬럼 10개) (0) | 2024.05.22 |
| 오라클 19c 일반 insert, insert all, union all insert 성능 테스트(컬럼 1개) (0) | 2024.05.19 |
| 오라클 19c Parallel DML 시 Direct Path Write 이벤트 관련 (0) | 2024.04.19 |